Posted by Andrew.
Google Chrome contains many new features that can be harnessed by developers and webmaster to deliver a better end-user experience. The JavaScript virtual machine used by Google Chrome also, the V8 JavaScript engine, has features such as dynamic code generation, hidden class transitions and precise garbage collection. This means that you can create more complex and more intensive AJAX applications with fewer speed and processing constraints with V8 engine.
Test your website in Google Chrome
If you are a web developer or webmaster, there are several useful tools to help you test your website in Google Chrome:
- JavaScript Debugger
- JavaScript console
- Web Inspector
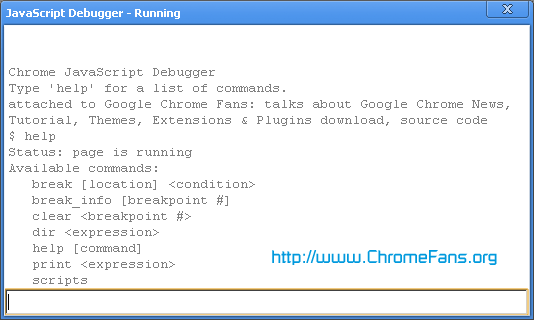
Click the Page icon, and then select Developer > Debug JavaScript to open the JavaScript Debugger window. You can also press the hotkey Ctrl+Shift+L. Type help for a list of commands. There is an article Sample debug session with Google Chrome JavaScript debuger from alexatnet.com.

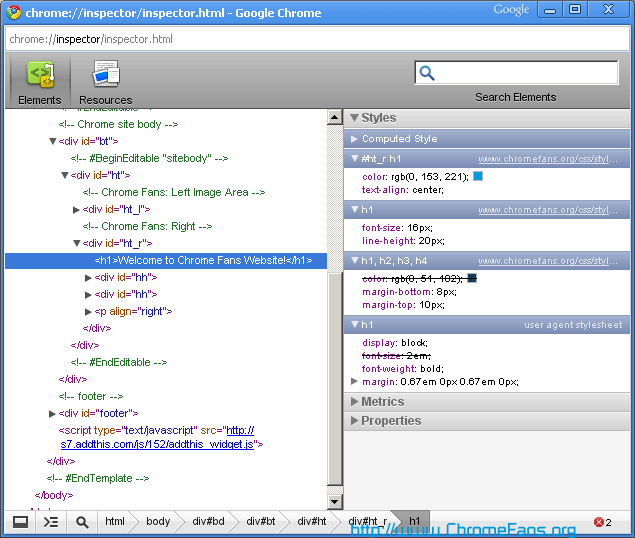
JavaScript console is a component of Google Chrome web inspector that analyzes the JavaScript code and any script errors associated with a specific webpage element. To launch JavaScript console window, click Page icon, and then select Developer > JavaScript console (or press Ctrl+Shift+J).
Right-click on any component on a web page and then select Inspect element to launch the web inspector. You'll be able to see the elements and resources associated with the component on which you clicked, including a hierarchy view of the DOM and a JavaScript console.

- Task Manager
- Other shortcuts
- about:
- about:dns
- about:plugins
- about:memory
- view-cache:[URL]
- view-source:[URL]
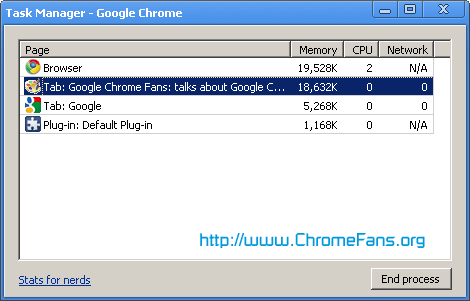
Use the Task Manager to get details (memory, CPU, and network) about all running Google Chrome processes, or to force a misbehaving tab or application to close. To open the task manager, click the Page menu icon, then select Developer > Task Manager (or press Shift+Esc).

Type any of the following shortcuts in the address bar to see more information:
Other resource about webmaster and Google Chrome
- Google Chrome Help: Developers and webmasters
- Google Webmaster Tool - provides you with detailed reports about your pages' visibility on Google
- V8 JavaScript engine
- Full list of Google Chrome about: pages
- Developers and Webmasters Resource about Google Chrome
- Previous article: Developers and Webmasters Resource about Google Chrome
- Next article: Developer and webmaster support about Google Chrome
abid
Tell me the URL of your site
I used it n my brother laptop yesterday and was shocked to see what my site looked like.
Please help...
and i wait on my web site
for more details click on this link
http://www.fromaliraza.blogspot.com
ok dears by by
i am wating
and i wait on my web site
for more details click on this link
http://www.wordinvestor.blogspot.com
ok dears by by
i am wating
http://wordinvestor.blogspot.com
Webmaster: How to test my website in Google Chrome?